

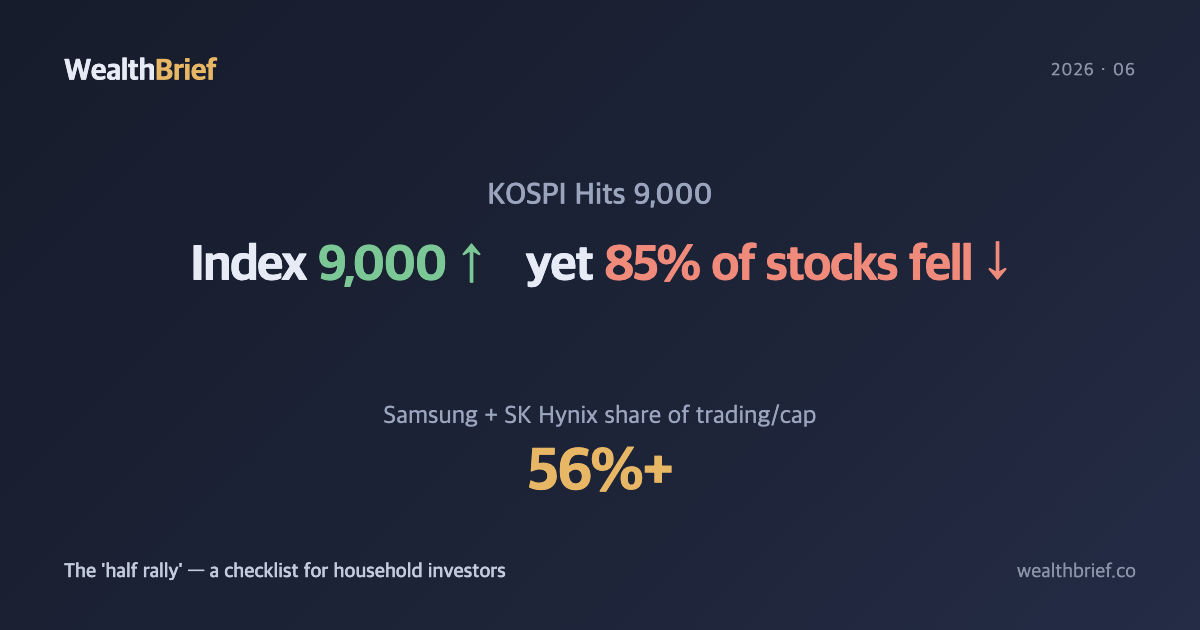
The Index Hit 9,000. So Why Is Your Account Flat?
The KOSPI cleared 9,000 for the first time ever, touching an intraday 9,362 on June 19 (Industry News, June 19, 2026). On the surface, it looks like a rally that lifted everyone. Yet plenty of investors opened their accounts and found them flat — or bleeding red. That is not a trick of perception. This rally was hot at the index level only; the market as a whole did not rise.
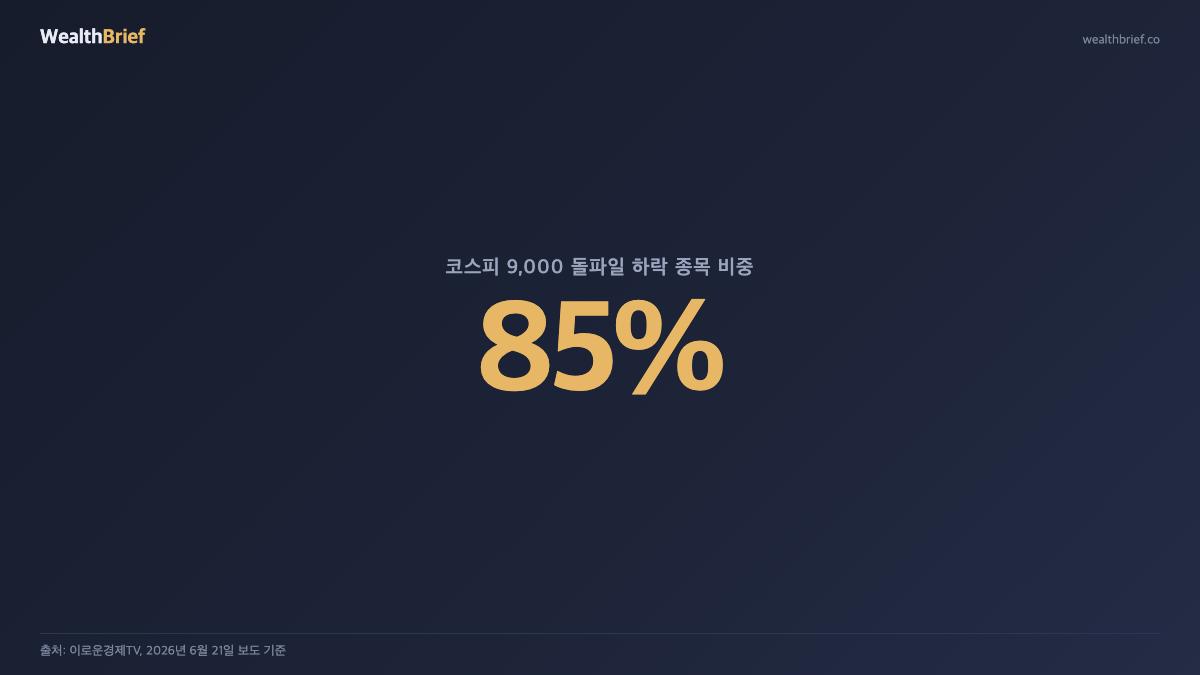
On the day the KOSPI crossed 9,000, only about two in ten stocks advanced. Roughly 85% of listed names fell (E-roun Economy TV, June 21, 2026). What dragged the index up was, in practice, two stocks: Samsung Electronics and SK Hynix. Market commentators have a name for this — a “half rally,” or a concentration market. Let us unpack what that concentration actually is, and what a household investor should be checking right now.
The Concentration, in Numbers
Start with the anchors. Every figure below carries its reporting date and source.
- Two-stock dominance: Samsung Electronics and SK Hynix together now account for more than 56% of KOSPI trading and market-cap weight by one tally (reported via Daum News, June 20, 2026). The whole market is, in effect, tethered to two names.
- Even the ETFs lean one way: ETFs marketed as “diversified” saw roughly a quarter of their trading volume pile into leveraged products tracking the Samsung-Hynix pair (JoongAng Ilbo, June 21, 2026). One IT leveraged ETF reportedly jumped 48% in a single week (Edaily Fund Watch, June 21, 2026).
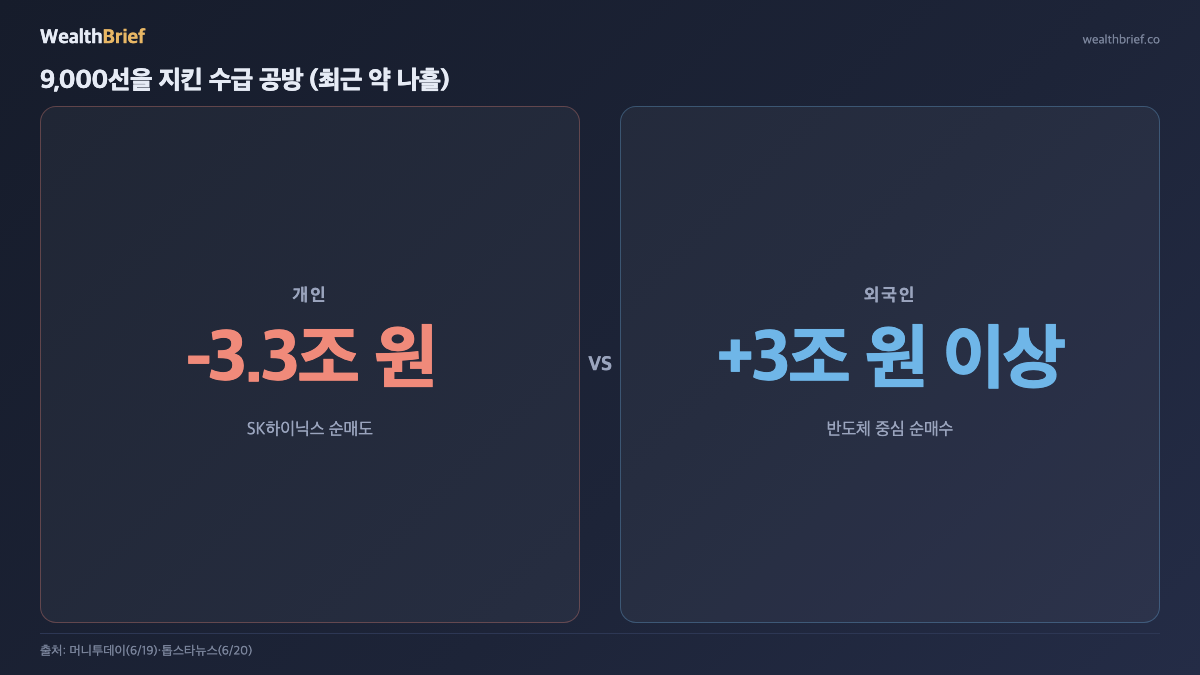
- The supply-demand tug of war: Retail investors net-sold about 3.3 trillion won of SK Hynix over four days (Money Today, June 19, 2026), while foreign investors net-bought more than 3 trillion won, concentrated in semiconductors, over a comparable stretch (Topstar News strategy note, June 20, 2026). Foreigners absorbed what retail dumped — and that is what held the 9,000 line.
In short, the index rose but market breadth was narrow. Breadth measures how widely the gains are actually spread across stocks. Narrow breadth is a signal that a handful of leaders are carrying the whole index on their backs.
Why the Crowding Got This Extreme
Three forces overlapped. First, AI and semiconductor earnings hopes. A global chip rally ran into Micron’s results, and that warmth flowed straight into Samsung and Hynix (Chosun Biz, June 19, 2026).
Second, the currency. The won-dollar rate averaged above 1,520 in June — its weakest level since the 1998 Asian financial crisis, roughly 28 years (Chosun Biz / Korea Economic Daily, June 21, 2026). A weak won makes Korean exporters, chips above all, cheaper in dollar terms and more attractive to foreign buyers. The soft won effectively underwrote the foreign bid.
Third, the rate path. The Bank of Korea has signaled it may be entering a hiking cycle, with some commentary floating two increases within the year (Global Economic, June 20, 2026). When rates are rising, money tends to favor large, profitable blue chips over loss-making, high-multiple growth names — another tailwind for the chip duopoly.
Why Concentration Cuts Both Ways
Crowding is sweet on the way up and equally painful when the direction flips. If two stocks hold up the index, then those same two stocks shaking will shake the index with them. Analysts have openly warned of rising volatility in this market (YTN, June 21, 2026).
Be especially wary of leveraged and single-stock ETFs. Leveraged products are built to track twice the daily move of an underlying index, which exposes them to “compounding decay” — losses that accumulate over time in a choppy, sideways market. A product that can rise 48% in a week can, by the same arithmetic, give much of it back just as fast. Many people walked in trusting the words “diversified fund,” only to discover they were placing a 2x bet on two stocks.
Be clear about one thing: no one can state for certain whether chips climb further or roll over. As long as foreign buying persists, the trend could extend. The point here is not a price forecast. It is knowing the exact size of the risk you are carrying.
A Household Investor’s Checklist
Before the index number sweeps you along, work calmly through these four checks. This is a general framework, not personal investment advice.
- Your true semiconductor weight: Add up not just the chip stocks you bought directly, but how much Samsung and Hynix sit inside the ETFs and funds you hold. What felt “diversified” may be concentrated on one side.
- Leverage and single-stock exposure: Check whether your ETF names carry “leverage,” “2X,” or “TR.” If they do, you are accepting decay risk in a flat or falling market.
- How much you bought on borrowed money: Positions bought on margin can be force-liquidated when volatility spikes. In a hiking cycle, the interest bill rises too.
- Your time horizon: Decide first whether you are after a short-term gain or a long hold. The same volatility has to be handled differently depending on the goal.
On the days the index prints record highs, the most expensive advice is the anxious whisper that everyone but you is getting rich. In a narrow-breadth market, what determines the outcome is less the price you pay than the size of the risk you take on after you are in.
This article is for informational purposes only and is not investment advice recommending the purchase or sale of any specific security or product. All figures follow the reporting dates and sources cited in the text and may change with market conditions. Investment decisions and their consequences rest with the individual investor.
Leave a Reply